AI · Satellite land-use analysis
See land-use change from space — with AI.
Earthdude AI turns any plot into a before/after satellite comparison and a reasoned, downloadable report — for RED III, ISCC Principle 1 and EUDR.
How it works
From a shape on the map to an audit-ready report in a few clicks.
- 01
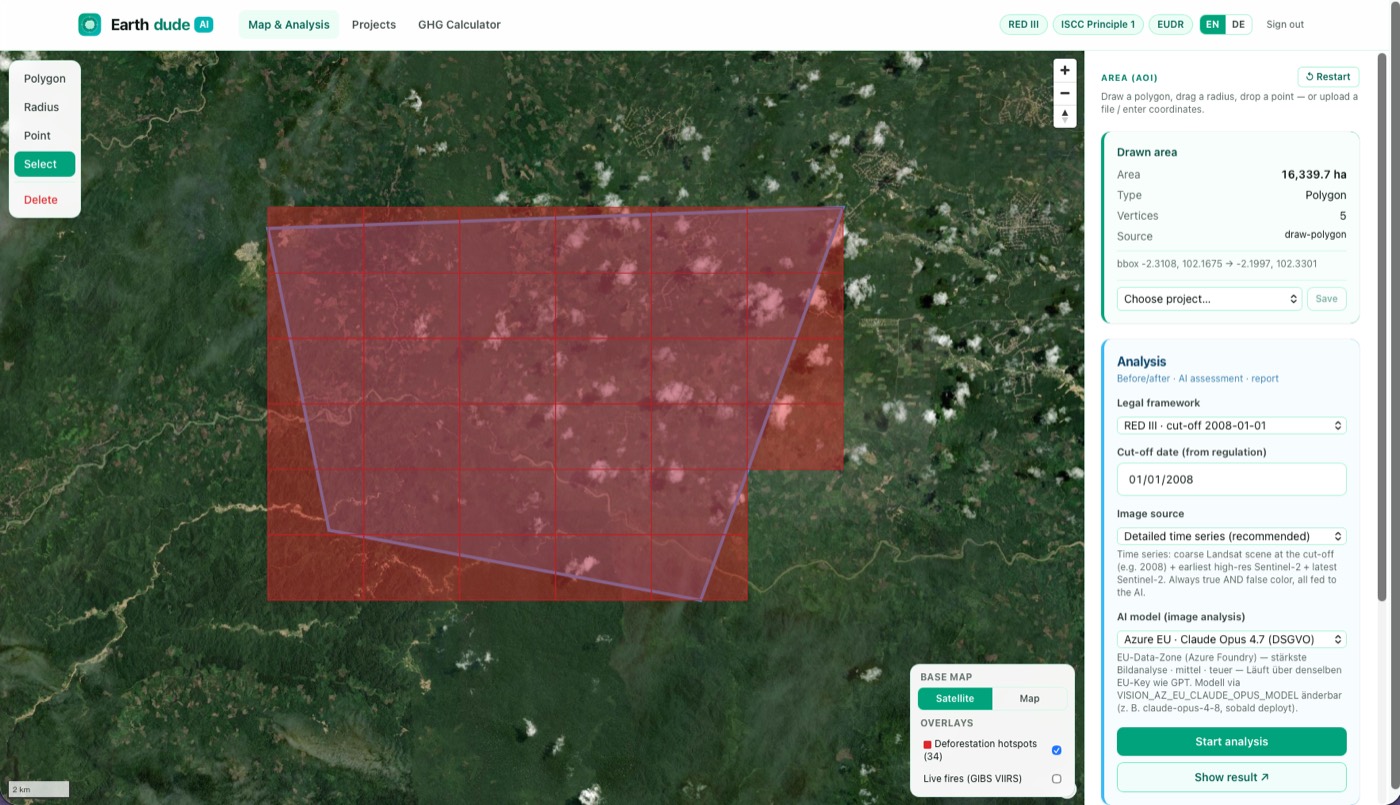
Define the area
Draw a polygon, drop a point with a radius, enter coordinates — or upload KML / KMZ / GeoJSON.
- 02
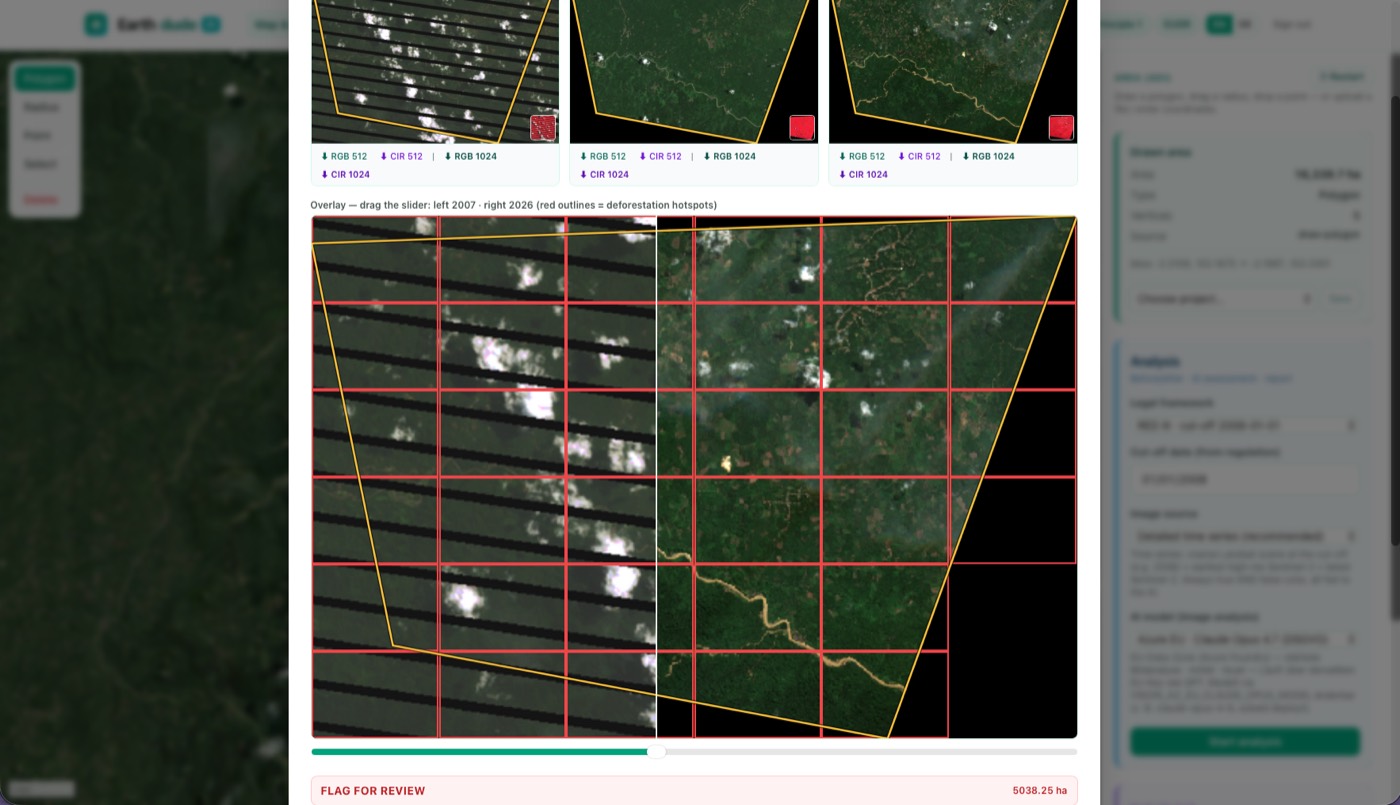
Before / after imagery
High-resolution satellite imagery around the legal cut-off date, side by side with a drag slider.
- 03
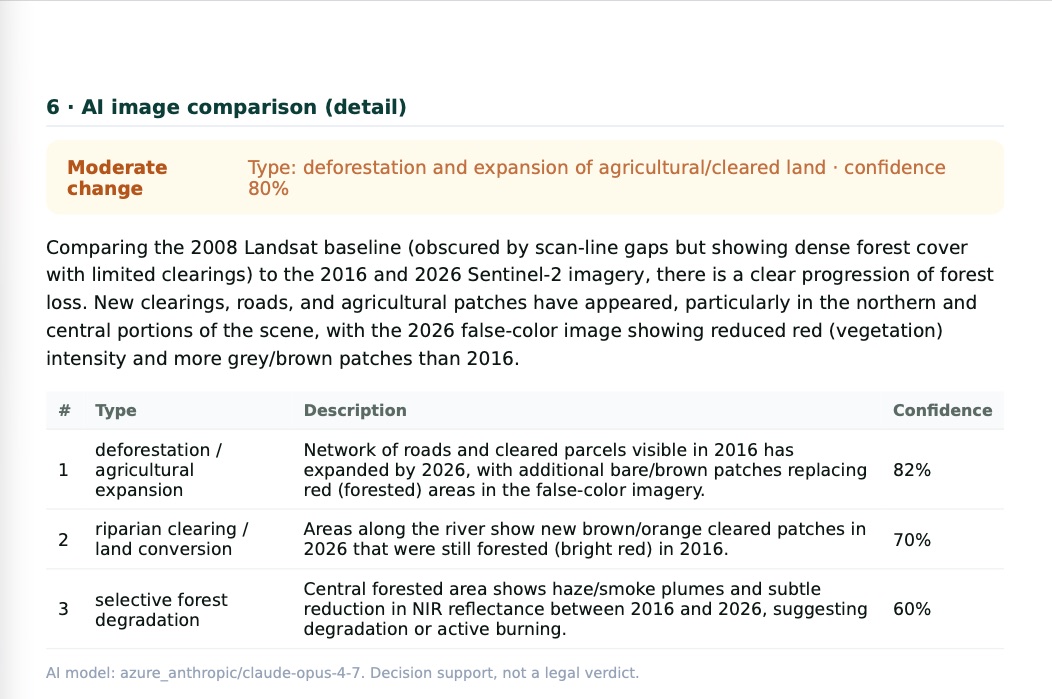
AI comparison
An AI model compares the scenes and describes the change — deforestation, clearing, degradation — with a confidence score.
- 04
Reasoned report
A downloadable report with imagery, findings and a verdict: no_flag · flag_for_review · insufficient_data.
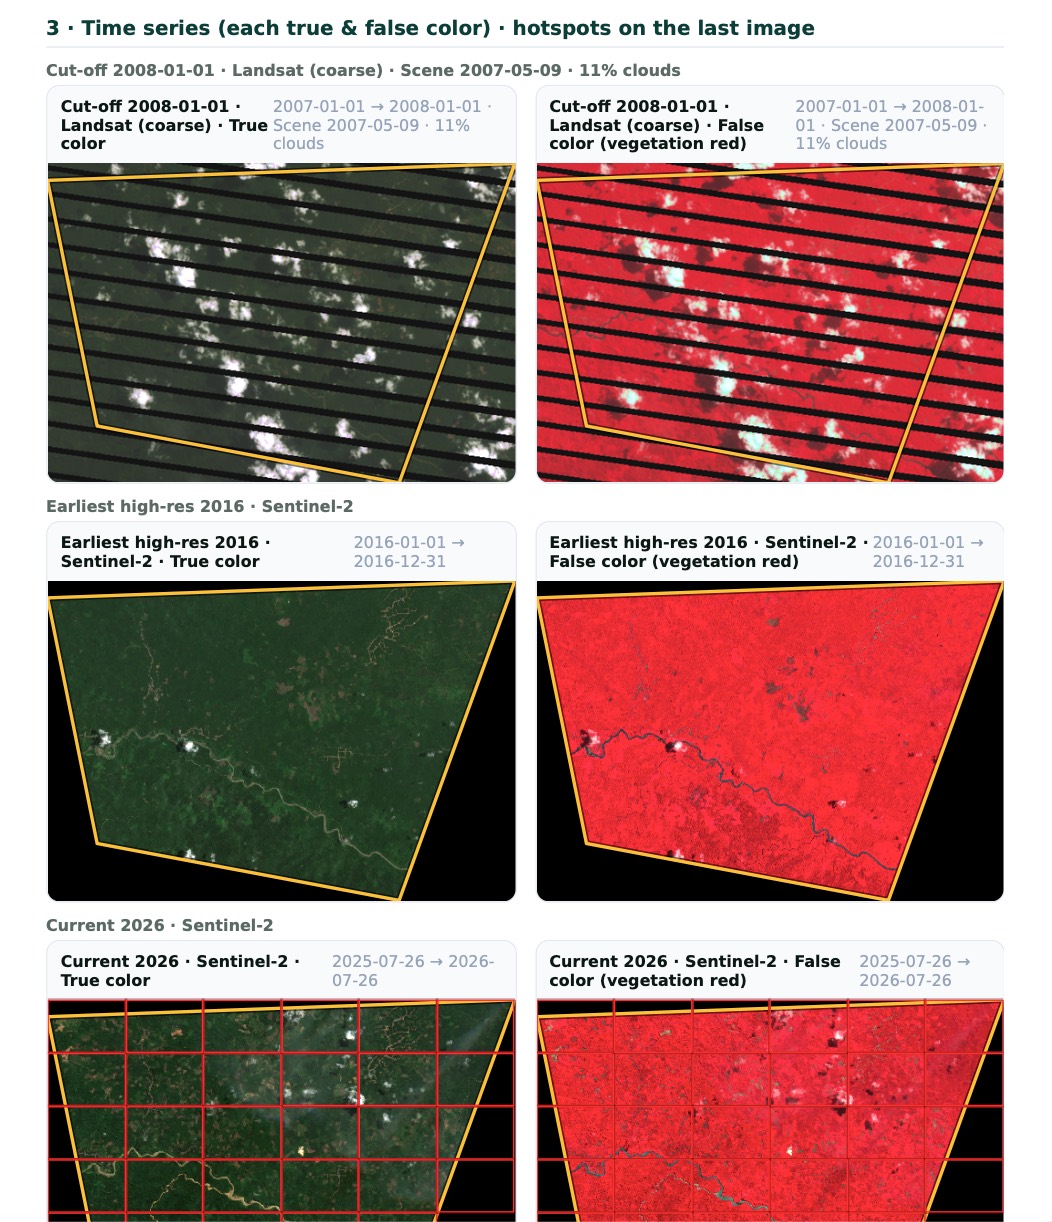
Inside the tool
Real screens — drawn area, before/after overlay, time series and the AI assessment.
Data sources
Free and open satellite layers, cross-referenced — no vendor lock-in.
-
High-res imagery
Esri World Imagery + Esri Wayback (historical) and EOX s2cloudless.
-
Sentinel-2 & Landsat
Copernicus Data Space (Sentinel-2 NDVI, true & false colour); Landsat for the older baseline.
-
NASA GIBS
NASA Global Imagery Browse Services — including VIIRS live-fire overlays.
-
Deforestation (GFW / Hansen)
Global Forest Watch Data API — Hansen tree-cover-loss hotspots on the map.
Decision-support, not an automated verdict
A check never returns an automatic “compliant”. It returns only no_flag, flag_for_review or insufficient_data — your own due-diligence stays in control.